 SALAT_CONVOLVE_BEAM
SALAT_CONVOLVE_BEAM
Convolve a specified synthetic beam (from an ALMA observations) to a user-provided map (e.g. from a simulation or observations with other instruments).
CALLING SEQUENCE:
>>> import salat
>>> convolve_image = salat.convolve_beam(data,[beammajor1,beamminor1,beamangle1],pxsize=pxsize)
| Option | Description | Status | Default |
|---|---|---|---|
data |
A frame in array format to be convolved with the ALMA beam. | required |
|
beam |
A list containing the beam parameters as [bmaj,bmin,bang] "salat_read". | required |
|
pxsize |
Pixel size in arcsec of the data to be convolved | required |
| Parameter | Description |
|---|---|
data_convolved |
The convolved image as array |
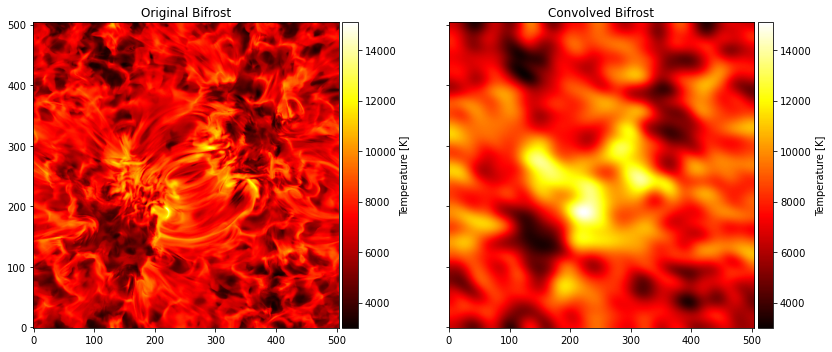
For this example a bifrost snapshot is used as input. Also, original and convolved images are plotted for comparision
>>> import salat
>>> import astropy.units as u
>>> import numpy as np
>>> import matplotlib.pyplot as plt
>>> import matplotlib
>>> from mpl_toolkits.axes_grid1 import make_axes_locatable
>>> filebifrost = path_folder + "bifrost_b3_frame400.fits"
>>> bifrostdata = fits.open(filebifrost)[0].data
>>> pxsizebifrost = 0.06 #This is assumed
>>> bifrostconv = salat.convolve_beam(bifrostdata,[beammajor1,beamminor1,beamangle1],pxsize=pxsizebifrost)
------------------------------------------------------
------------ SALAT CONVOLVE BEAM part of -------------
---- Solar Alma Library of Auxiliary Tools (SALAT)----
For the input data, NANs are not properly handle
Please use fill_nans parameter when loading fits
------------------------------------------------------
#PLotting
fig,ax = plt.subplots(ncols=2,figsize=(12,5),sharex=True,sharey=True)
imorg = ax[0].imshow(bifrostdata,origin='lower',cmap='hot')
divider = make_axes_locatable(ax[0])
cax = divider.append_axes('right', size='5%', pad=0.05)
cb = fig.colorbar(imorg, cax=cax, orientation='vertical',label=r'Temperature [K]')
imcon = ax[1].imshow(bifrostconv,origin='lower',cmap='hot')
divider = make_axes_locatable(ax[1])
cax = divider.append_axes('right', size='5%', pad=0.05)
cb = fig.colorbar(imorg, cax=cax, orientation='vertical',label=r'Temperature [K]')
ax[0].set_title(r'Original Bifrost')
ax[1].set_title(r'Convolved Bifrost')
plt.tight_layout()
Back to the list of Python functions