 SALAT_PLOT_MAP
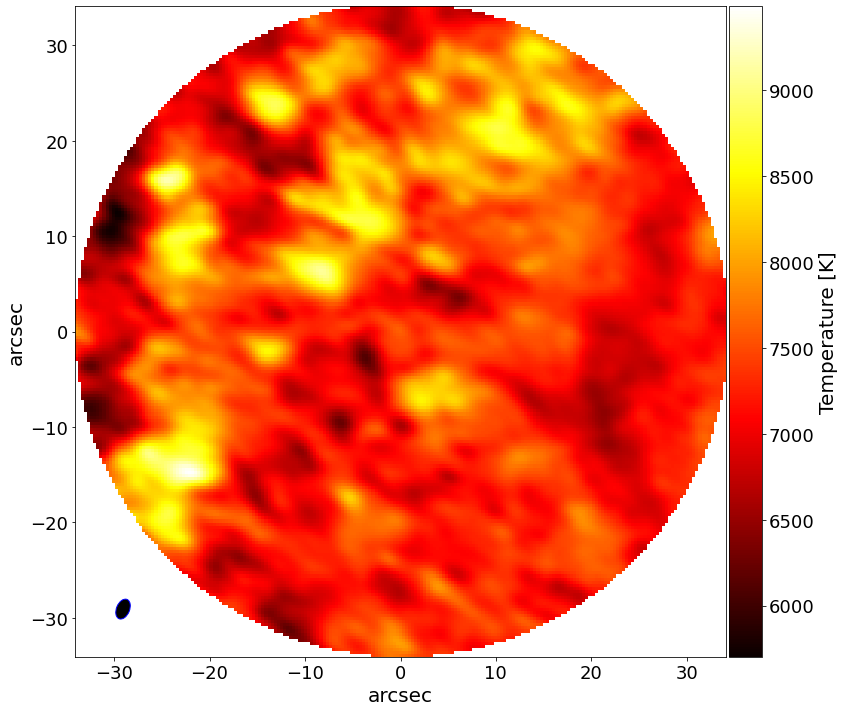
SALAT_PLOT_MAP
This function makes map plot centered at (0,0) arcsec, save images as JPG or PNG files (optional).
CALLING SEQUENCE:
>>> import salat
>>> salat.plot_map(almadata,beam,pxsize,cmap='hot',average=False,timestp=0,savepng=False,savejpg=False,outputpath="./")
| Option | Description | Status | Default |
|---|---|---|---|
almadata |
Datacube as array from "salat_read". It can be 2D and 3D | required |
|
beam |
List with beam info as [bmaj,bmin,bang] from "salat_read" |
required |
|
pxsize |
Pixelsize in arcsec from "salat_header" | required |
|
cmap |
String of colormap name | optional |
hot |
average |
If True, it plots the average image of a 3D cube |
optional |
False |
timestp |
Integer, index of frame for plotting | optional |
0 |
savepng |
If True, it saves image in path as PNG |
optional |
False |
savejpg |
If True, it saves image in path as JPG |
optional |
False |
outputpath |
Directory path to save image | optional |
./ |
| Parameter | Description |
|---|---|
fig |
Matplotlib plot of map is produced. |
>>> import salat
#Plot map timestp=100 using colormap='jet' ans saving as jpg
>>> salat.plot_map(almadata,beam,pxsize,cmap='jet',average=False,timestp=100,savepng=False,savejpg=True,outputpath="./")
---------------------------------------------------
------------ SALAT PLOT MAP part of ---------------
-- Solar Alma Library of Auxiliary Tools (SALAT) --
Back to the list of Python functions