 SALAT_STATS
SALAT_STATS
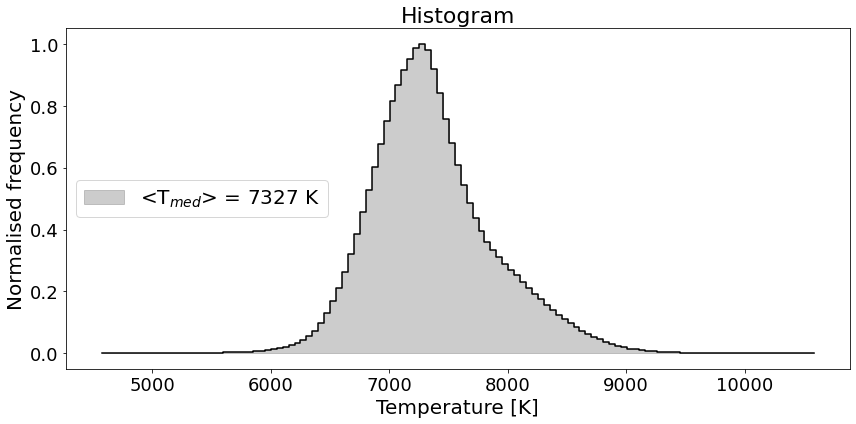
Reads in a SALSA level4 FITS cubes and outputs basic statistics of the data cube (or a frame) as a dictionary and print them in terminal (optional). A histogram is also plotted (optional)
CALLING SEQUENCE:
>>> import salat
>>> datastats = salat.stats(almadata,Histogram=True,)
| Option | Description | Status | Default |
|---|---|---|---|
almadata |
Datacube as array from "salat_read". It can be 2D and 3D | required |
|
Histogram |
If True, it plots a temperature distribution histogram |
optional |
False |
SILENT |
If True, no information is printed to the terminal. |
optional |
False |
| Parameter | Description |
|---|---|
datastats |
Python dictionary with computed stats. |
fig |
A matplotlib histogram of temperature distribution is produced if Histogram=True. |
>>> import salat
>>> datastats = salat.stats(almadata,Histogram=True,)
---------------------------------------------------
--------------- SALAT STATS part of ----------------
-- Solar Alma Library of Auxiliary Tools (SALAT) --
Computing Statistics
----------------------------------------------
----------------------------------------------
|  Statistics:
----------------------------------------------
|  Array size: t = 1200 x = 213  y = 213
|  Min =  4573.08642578125
|  Max =  10635.462890625
|  Mean =  7387.675114081175
|  Median =  7327.32373046875
|  Mode =  7305.5439453125
|  Standard deviation =  518.919333625818
|  Variance =  269277.274810663
|  Skew =  0.5515735886224322
|  Kurtosis =  0.7880637528361976
|  Percentile 1 =  [6318.5185498  8812.49609375]
|  Percentile 5 =  [6645.40478516 8361.46972656]
----------------------------------------------
Back to the list of Python functions